Calculating Profit and Loss (P&L) for your trading strategy can be surprisingly tricky at times. Traders are often surprised when their calculations of realised and unrealised P&Ls don’t match up. Today let’s see how it can be done by going through a Moving Average (MA) Crossover strategy.
To start with we create an arbitrary price series from normally distributed random numbers. Of course, you could also use market data from your favourite instrument, it doesn’t matter so much here as we are focussed on calculating strategy P&L curves.


In the next step we create a backtest. In this backtest, we loop through our price data, calculate two moving averages and whenever the two moving averages cross we change from short to long and vice versa.

This part of the code shows a switch from a long to a short entry. When the second moving average is smaller than the first and we are not short, we first calculate the realised PnL, which is the profit of the whole trade. But first We want to make sure that we are already in a position, by using the “if inpos” condition. For long trades we subtract the entry price from the current price and for short trades we do the opposite.
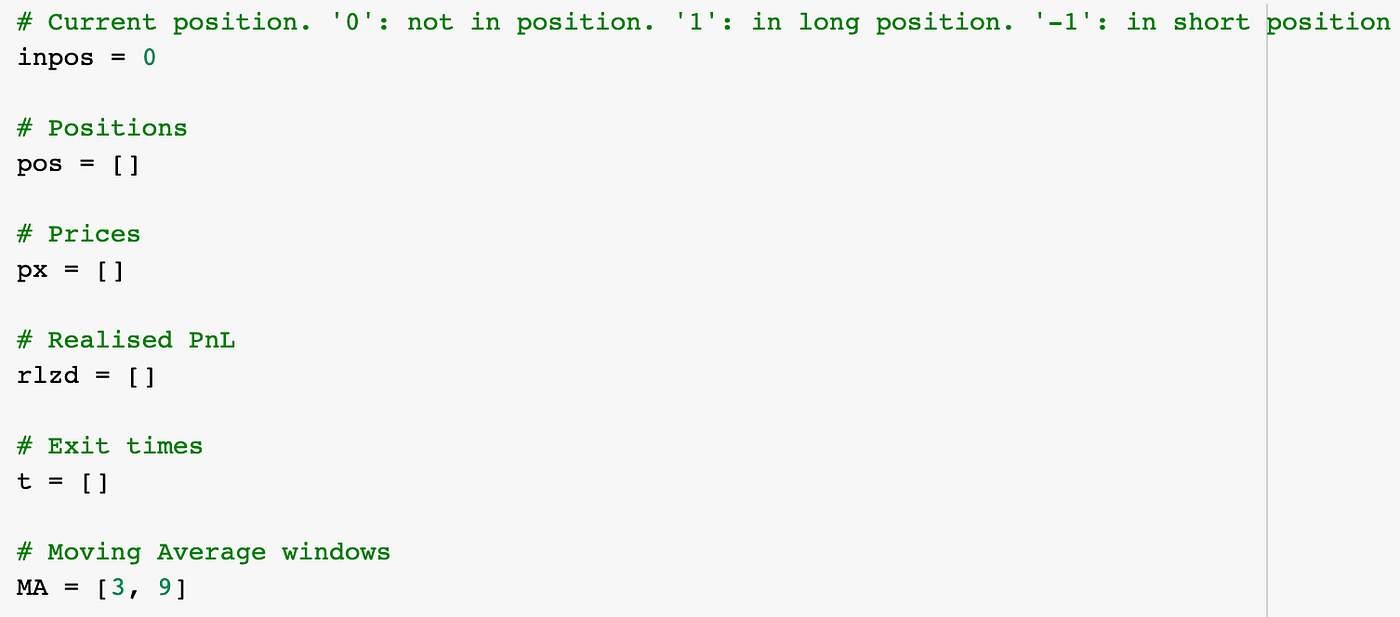
This, of course, is a simplified backtest where we assume “perfect” execution, zero spreads and no commission. Note that
- we update the entry price after the PnL calculation, otherwise they would always be zero.
- we also update our trade direction with “inpos”.
- exit times are captured in the list t, which we need for plotting our results later
Now that we’ve handled entries and exits, let’s plot the realised P&L of the strategy:
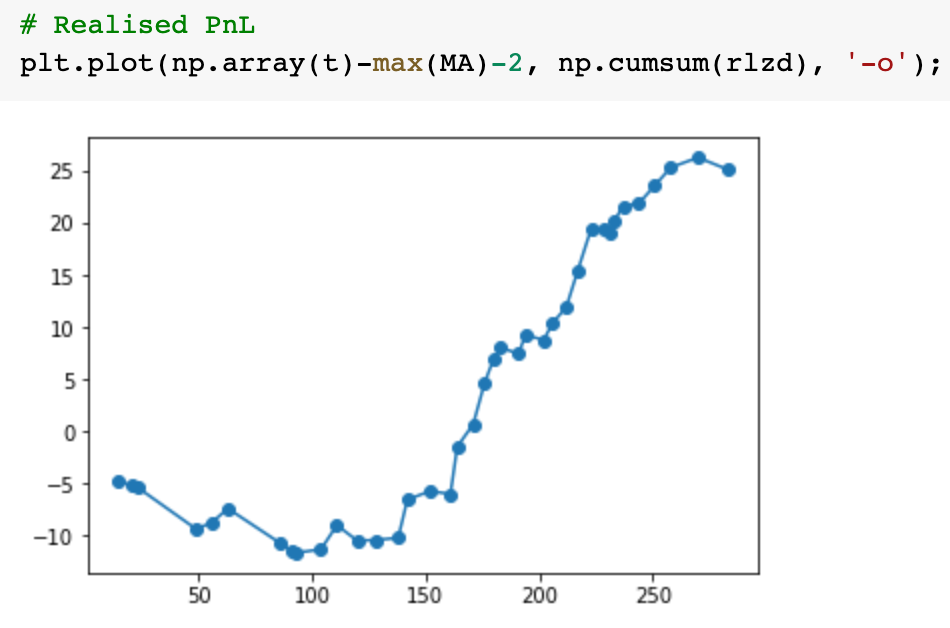
This looks reasonable, however, it does not tell us our performance during the trades. For that, we need to calculate the unrealised P&L. It is vitally important that the two PnL calculations match up, otherwise our backtest will most likely give the wrong results one way or the other.
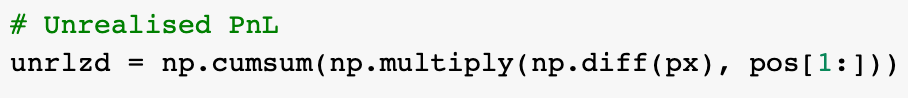
So, what’s going on here? Check out 2:50″ of the accompanying video.
Next, we can compare the realised and unrealised P&Ls:

Notice that the final realised and the final unrealised PnL do not agree exactly. This is because our backtest ends in the middle of a trade and there is a residual unrealised profit for that.
Finally, let’s plot them:

In some cases we have significant drawdowns that are not apparent when we only calculate the unrealised P&L:

That’s all for today. Please stay tuned for the next Quant article!